The COVID-19 Pandemic: A Classic Example of a Black Swan

Printed from: https://newbostonpost.com/2020/05/03/the-covid-19-pandemic-a-classic-example-of-a-black-swan/

A Black Swan is an event, positive or negative, that is deemed improbable yet causes massive consequences.

                                                       —  Nassim Nicholas Taleb, The Black Swan, 2007
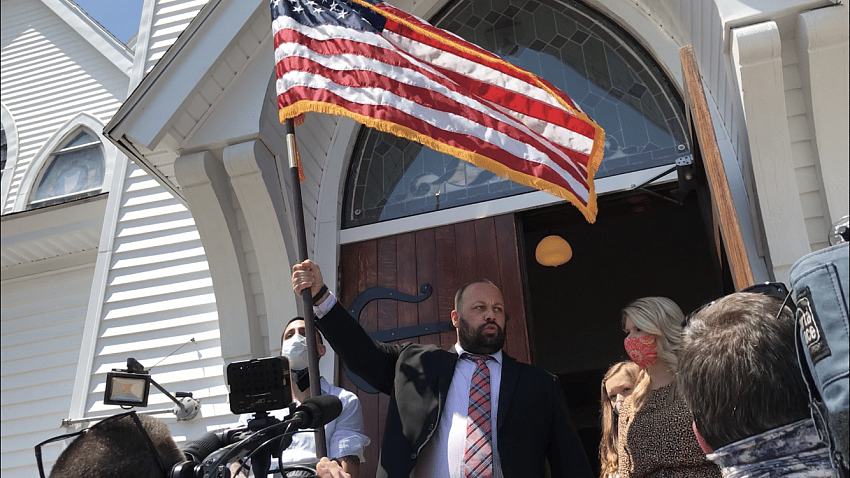
 

Nassim Nicholas Taleb popularized the term Black Swan event in his celebrated book The Black Swan: The Impact of the Highly Improbable. The popular book was published at the beginning of the great Financial Panic of 2007-2009. Many now know the main thesis of the book:  that unexpected events can shake the world.

The world is clearly in the grip of a Black Swan event. While many people know the meaning of a Black Swan event, fewer know the origin of the term. Nassim Taleb explains the genesis of the term in his book:  “Before the discovery of Australia, people in the Old World were convinced that all swans were white, an unassailable belief as it seemed completely confirmed by empirical evidence.” But in 1697, a Dutch explorer, Willem de Vlamingh, discovered Australia and with it, black swans, thereby overturning the universal belief, derived from centuries of observation, that all swans are white.

In his book, Taleb writes that a Black Swan event has three attributes. First, it is an outlier, which means it lies outside the realm of regular expectations. Second, it carries an extreme impact. Third, human nature makes us concoct explanations for its occurrence after the fact, making it explainable and predictable. A good example of a Black Swan event described in his book is what happened in his native land, Lebanon.

For more than a thousand years, the Eastern Mediterranean seaboard accommodated peacefully more than a dozen ethnicities, religions, and sects. There were Maronite Christians, Sunni Muslims, Shiite Muslims, Druze, and many others. Many languages were spoken, and the land was governed by different nations and empires over the centuries. During much of the 20th century, Lebanon was peaceful and described by many as a paradise — the Paris of the Middle East.

In 1975, everything collapsed. A civil war broke out and lasted for 15 years, devastating much of Beirut and the environs. As Taleb writes, it turned Lebanon from heaven to hell. And no one expected it after 1,100 years of harmony. A classic example of a Black Swan event.


The U.S. Economy in Early 2020

During the first two months of 2020, the U.S. economy was hitting on all cylinders. U.S. Gross Domestic Product grew at a pace of 2.3% in 2019 — below the administration’s target but still reasonable growth. Phase I of the trade deal with China had been signed in mid-January. Inflation was under control, and interest rates were very low and forecast to move even lower in 2020. Unemployment was 3.5% — the lowest level in 50 years. And economists were predicting another year of Gross Domestic Product growth in excess of 2%. Some 275,000 new jobs were created in February. The stock market reflected this positive scenario and had advanced almost 5% during the first seven weeks of the year.

But then the Black Swan event arrived. COVID-19. Investors began to realize that the coronavirus would dramatically change life as we know it. Economies around the world would be seriously damaged. Gross Domestic Product would shrink in every country. To make matters worse, as travel decreased and demand for energy-related products diminished, Russia and Saudi Arabia couldn’t agree on oil production cuts, flooding the world with oil and devastating energy markets.

By the end of February, the Standard & Poors 500 Index was down 12.9% from the intraday high of 3393 reached ten days earlier. And that was just the beginning. The drop from the peak on February 19 to the intraday low of 2192 (thus far) reached on March 23 was -35.4%. The panicked selling by investors caused major U.S. stock market indexes to repeatedly plunge more than 7% premarket or during short bursts during the day, resulting in the markets halting trading for fifteen-minute spells on four occasions during an eight-day period. Volatility had returned to the days of 2007-2009 with a vengeance.


How Does this Bear Market Compare with Others?

According to Bloomberg, the Dow Jones Industrial Average has dropped 20% or more (the definition of a bear market) twenty times over the last 120 years. That is an average of one bear market every six years. In twelve of the bear markets, the decline was 30% or greater. Over the last century, bear markets have, on average, lasted around eight months from peak to trough. The longest decline was five years during the Great Depression. The bear market crash of 1987 lasted less than three months. The current bear market set the record for the fastest, taking less than a month. The chart below shows the four bear markets that have taken place since my investment firm Bradley, Foster & Sargent was founded in 1994:


Bear Markets

1994 – 2020

Source: Bloomberg


Although the stock market’s sickening plunge over the past several months has unnerved many investors, the chart above shows that the damage to equities in the bear market caused by the Internet bubble in 2000-2002 was far greater — with the NASDAQ Composite down almost -78%. And that bear market lasted 2½ years. In similar fashion, the bear market during the 2007-2009 Panic, when there was a near meltdown of the entire U.S. financial system, caused far more pain for equity investors, with the total Standard & Poors 500 Index down almost 57% from peak to trough.

Nonetheless, watching one’s assets decline by 25% or more in less than a month during this bear market has been painful indeed. Yet because of the 2019 stock market advance of 30% or more in 2019, the S&P 500 index, from the end of 2018 through April 6, 2020, has actually shown a positive total return of 8.97%. But, as psychologists have frequently demonstrated in experiments:  a loss hurts twice as much as the pleasure received from a gain of an equal magnitude.


Why the 20% Market Rebound Since March 23 When Things Seem To Be Getting Worse?

As of April 8, the stock market had bounced back more than 20% since it hit the intraday bottom of 2192 on March 23. This has happened in the face of more than 600,000 confirmed cases of COVID-19 in the United States. The tracking of the daily reports of COVID-19 makes it seem probable that as many as 2 million people in the United States might become infected, resulting in deaths of as many as 100,000 people. Moreover, the lockdown in most of the country has resulted in the loss of approximately 30% of U.S. economic output. With this challenging situation facing investors, why would the market bottom? Before laying out some thoughts on this, it is important to state that the market may well revisit its lows or perhaps penetrate the support level set on March 23 in the weeks to come. But the following are some reasons why investors have caused stocks to rebound over the past two weeks:

    • Above all, investors hate uncertainty — the unknown. Once bad news is delineated and quan­tified, investors can get their heads around it and understand the worst that might happen.
    • The experience of China and other nations gives encouragement that shutdowns can slow and ultimately stop the spread of the virus. This should ultimately occur in the United States, as well. The curve will flatten and then decline, and there are early signs that this might happen soon.
    • Announcements from various pharmaceutical companies give hope that a vaccine against COVID-19 will be developed by 2021.
    • Congress dithered but then finally passed the CARES Act. Investors postulated that there would be a $2 to $3 trillion loss of Gross Domestic Product in the 2nd and 3rd quarters of 2020 due to lockdowns. The CARES Act authorizes the spending of $2.2 trillion to fill this hole in the economy. More money may be on the way, too, from Congress.
    • The funds from CARES will be used where it is most needed — to give emergency relief to individuals and families; small businesses; certain industries and large corporations, hospitals, and public health agencies; federal safety nets; state and local governments; and education.
    • A majority of the trading on the U.S. stock market now is high frequency, algorithmic trading and hedge funds. It appears as if many of the shorts have covered their positions — for now.


Where Do We Go from Here?

In these uncertain days, there is a flood of information on the Internet and TV about COVID-19 and its impact on both the economy and the capital markets. Some pundits spill barrels of ink predicting that this Black Swan event will have a profoundly negative impact on the country for several years, while others see an economic recovery by the fourth quarter of 2020. Some predict a long bear market, while others believe that the market will snap back by the end of 2020 — especially with short-term interest rates near zero.

At Bradley, Foster & Sargent, we do not have a crystal ball; therefore we cannot tell exactly how this Black Swan event will play out or how it will affect the economy and the markets. There is, however, an analogy that might help put things in perspective:  This COVID-19 pandemic can be compared to an employee strike at a high-quality industrial company. Before the strike, the company is operating at full capacity with an excellent product, strong sales, and good earnings growth. The strike brings everything to a halt. Production stops, and with it, cash flow.

But some months later, the strike is settled, and the company returns to its previous high performance. Investors generally look beyond the short-term effects of the strike and value the company on its long-term prospects.

In the same way, we do not believe that the positive long-term prospects of the American experiment in democratic capitalism is over. In our view, the economy will recover — whether in the second half of 2020 or in 2021 — and most of the high-quality companies in which we invest will come back strongly with it. The chart below shows the performance of the S&P 500 Index since Bradley, Foster & Sargent’s inception in 1994 through last year. The cumulative total return during this 25½-year period is up 1,091% — almost elevenfold. If someone invested $100,000 in the S&P 500 in July 1994, with dividends reinvested, it would have resulted in $1,091,000 on December 31, 2019. The average annual return over this period was 10.2%. This occurred despite the shattering bear markets caused by the Internet bubble and the financial panic of 2008. This is why we, at Bradley, Foster & Sargent, stress the importance of time in the market, not timing the market, as the chart below shows:


S&P 500 Index

July 1, 1994 – December 31, 2019

Source: Bloomberg


In closing, the following are some suggestions for getting through the coming rocky months without excessive worry and stress.

First, unless you are a short-term trader, don’t invest in stocks if you need the funds in less than five years. Second, make sure to think through carefully your long-term financial goals and set asset allocation target ranges appropriately. Third, unless circumstances change, do not alter your asset allocation ranges in a bear market. Fourth, don’t focus on averting short-term losses to the detriment of achieving those long-term goals. Fifth, don’t believe all the predictions of so-called “experts.” Sixth, don’t stay glued to financial channels on cable TV, and don’t watch the daily fluctuations and performance of your portfolio. Seventh, use the bear market to upgrade your portfolio by swapping into top-notch companies that will survive this Black Swan event and prosper in the future.

While the data on COVID-19 from China may not be accurate, we do know that all of Apple’s and Starbucks’s retail outlets in China reopened in March.

This Black Swan event will pass in America, too.


Robert H. Bradley is Chairman of Bradley, Foster & Sargent Inc., a $3.97 billion wealth management firm that has offices in Hartford, Connecticut and Wellesley, Massachusetts. Read other articles by him here.